Bitcoin vs. Stocks: 10 Years of Return Data
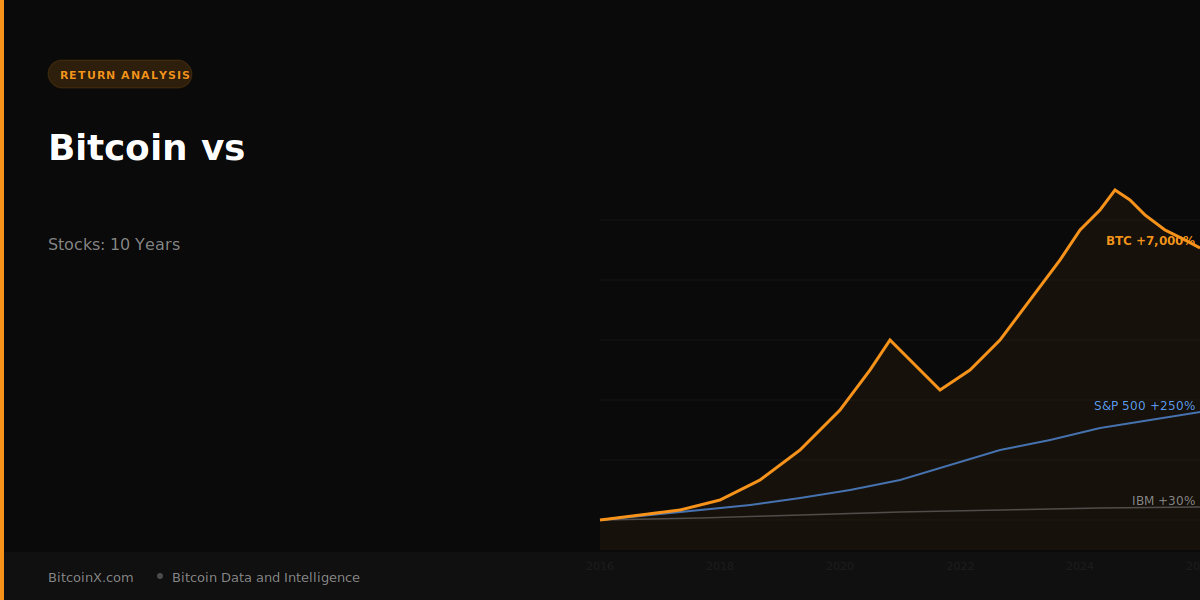
If you had invested $1,000 in Bitcoin on March 26, 2016, it would be worth approximately $71,238 today — a return of over 7,000%. The same $1,000 invested in Apple stock on the same date would be worth roughly $6,400 — a return of 540%. Microsoft would have returned around 800%. The S&P 500 index would have roughly tripled.
These are not cherry-picked numbers. They reflect 10 years of actual price history drawn from the same data sources we use to power our BitcoinX analytics pipeline.
Why the Comparison Matters
Bitcoin is increasingly compared to traditional investment assets, but the comparison is rarely done with precision. Most discussions rely on approximate numbers, selected start dates, or cherry-picked timeframes. We built our database specifically to enable rigorous comparisons — pulling daily price data for Bitcoin alongside stocks, ETFs, and economic indicators, all from the same date range.
The honest version of the Bitcoin vs. stocks comparison is more nuanced than either bulls or bears typically present.
The Full Picture
Bitcoin has outperformed virtually every traditional asset over any 4-year period since 2016. But that outperformance has come with extreme volatility. Bitcoin has experienced three drawdowns of over 70% since 2016 — declines that would be catastrophic in a traditional portfolio context.
An investor who bought Bitcoin in December 2017 at the peak and sold in December 2018 at the trough would have lost over 80% of their investment. The same investor who held through to 2021 would have been up over 300%.
This is the central tension in Bitcoin investing: the returns are historically extraordinary, but the ride is genuinely brutal. Most investors — even those who intellectually understand the thesis — are psychologically unable to hold through a 70% drawdown.
Key Data Points (as of our latest data)
Bitcoin vs. S&P 500 (since 2016): Bitcoin has returned approximately 70x. The S&P 500 has returned approximately 3.5x.
Bitcoin vs. Gold (since 2016): Gold has returned roughly 90% over the same period. Bitcoin has returned over 7,000%.
Bitcoin vs. NVIDIA (since 2016): NVIDIA is the only major stock that comes close, returning over 4,000% since 2016 — largely driven by the AI boom. Bitcoin still outperforms, but not by the dramatic margin it holds over most stocks.
Bitcoin vs. IBM (since 2016): IBM, often cited as a blue-chip alternative, has returned approximately 30% since 2016 — a period of virtually zero real growth after inflation.
What the Data Doesn’t Tell You
Raw return data doesn’t capture taxes, transaction costs, or the psychological cost of volatility. It also doesn’t capture what would have happened if an investor had dollar-cost averaged rather than making a single lump-sum investment.
A disciplined DCA investor who put $100 per week into Bitcoin since 2016 would have a very different experience than someone who invested their entire savings at the December 2017 peak.
We are building a “What If” calculator that will let you run exactly these scenarios — selecting any start date, amount, and investment strategy and seeing the real outcome against any stock or asset in our database. Coming soon to BitcoinX.