
BitcoinX has tracked Bitcoin since the early days. We’ve rebuilt our platform around one idea: the best Bitcoin decisions come from real data and analytics, not hype. Every chart, every calculator, and every signal on this site is powered by a live data pipeline updated daily — pulling from the blockchain, global markets, and 10 years of price history.
About Our Data Pipeline
Every number on this site comes from a live data pipeline we built and maintain ourselves. Bitcoin price data is sourced daily from CoinGecko. Network data — hashrate, difficulty, mempool fees — comes from mempool.space and Blockchain.info. Fear and Greed data is sourced from Alternative.me. Macro economic data including M2 money supply, CPI, federal funds rate, and gas prices is sourced from the Federal Reserve’s FRED API.
All data is ingested into Google BigQuery, processed through a series of transformation layers, and served to our dashboards and calculators in real time. The pipeline runs daily. Every chart you see reflects data from the previous 24 hours, not week-old numbers from a cached API.
This matters because most Bitcoin data and analytics sites rely on third-party embeds or infrequently updated data sources. We built our own infrastructure specifically to have full control over data quality, history, and freshness.
Explore Bitcoin Data and Analytics
Bitcoin is one of the most data-rich assets ever created. Every transaction, every block, every miner and every market participant leaves a verifiable trail on a public blockchain. The challenge has never been a lack of data — it has been making sense of it.
BitcoinX aggregates and analyzes the metrics that matter most: price and moving averages, halving cycle position, miner health signals, market sentiment, and technical cross indicators. Each dashboard below is powered by a live data pipeline updated daily, pulling from the Bitcoin blockchain, global financial markets, and nearly a decade of historical price data.
Whether you are tracking the current halving cycle, monitoring the Puell Multiple for miner stress signals, or simply trying to understand where Bitcoin stands relative to its long-term moving averages, everything you need is here — in one place, always current, always free.
What You Can Track at BitcoinX
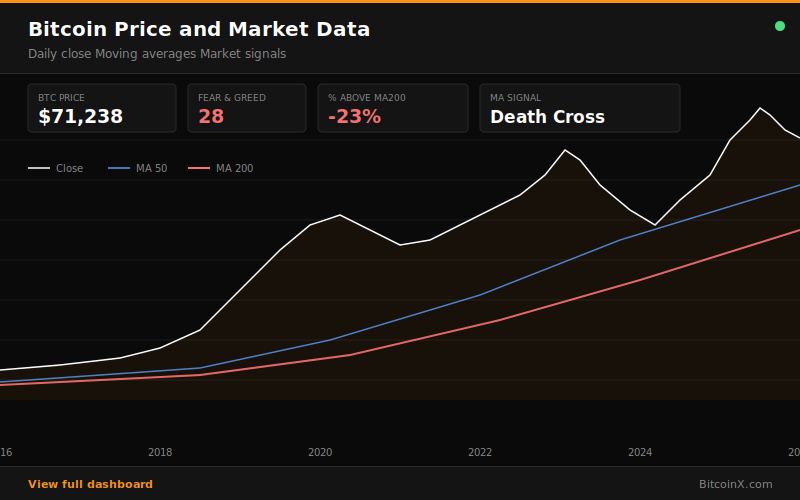
Bitcoin Price and Moving Averages Our daily price dashboard tracks Bitcoin’s closing price alongside its 7, 30, 50, and 200-day moving averages. Moving averages are one of the most reliable tools for identifying Bitcoin’s long-term trend. When price is above the 200-day MA, Bitcoin is in a structural uptrend. When it is below, as it is today, the long-term trend has weakened. We also track the percentage above or below the MA200 — a metric that has historically signaled deep value when below -30% and overheating when above +100%.
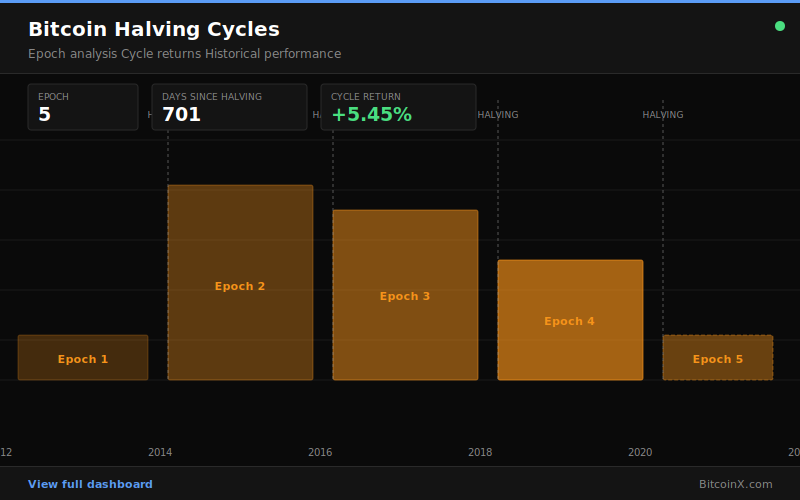
Bitcoin Halving Cycles Bitcoin’s four-year halving cycle is the most important structural force in its price history. Our halving cycle dashboard tracks which epoch we are in, how many days since the last halving, the current cycle return relative to the halving price, and how this cycle compares to all previous ones. Understanding halving cycle dynamics is essential context for any serious Bitcoin analysis.
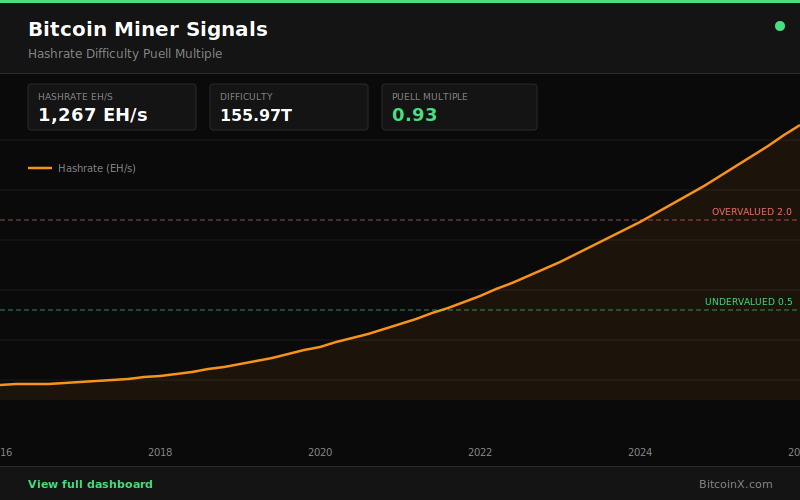
Bitcoin Miner Signals Miners are the backbone of the Bitcoin network. Their economic health — measured through hashrate, difficulty, and the Puell Multiple — provides some of the most reliable on-chain signals in Bitcoin analysis. When miners are stressed and the Puell Multiple falls below 0.5, Bitcoin has historically been in a zone of deep value. When miners are thriving and the Puell Multiple exceeds 4.0, the market has historically been near a top. We track all three metrics daily.
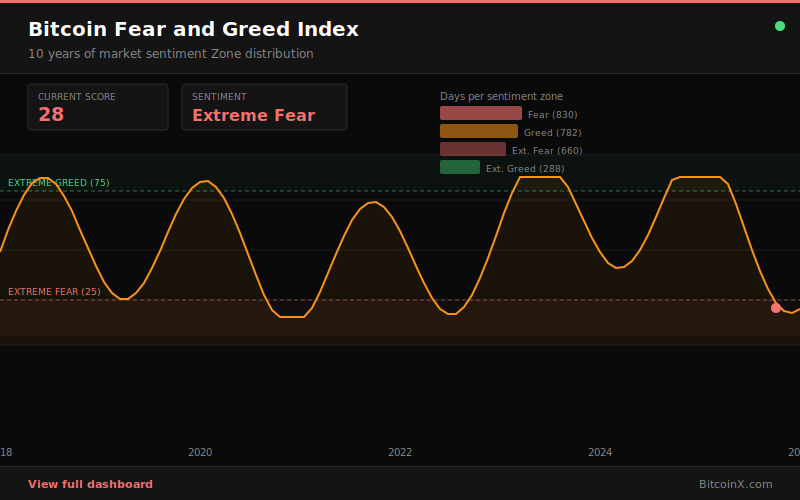
Bitcoin Fear and Greed Index Sentiment is one of the most powerful forces in any market, and Bitcoin is no exception. Our Fear and Greed dashboard tracks the daily index reading going back to 2018, showing how today’s sentiment compares to every major Bitcoin top and bottom in history. The data consistently shows that extreme fear — readings below 25 — has preceded significant price recoveries, while extreme greed has preceded corrections.
Bitcoin MA Cross Signals The golden cross (MA50 crossing above MA200) and death cross (MA50 crossing below MA200) are among the most watched technical signals in Bitcoin trading. Our MA cross dashboard tracks the current signal, the exact values of both moving averages, and the percentage above or below the MA200 in real time.
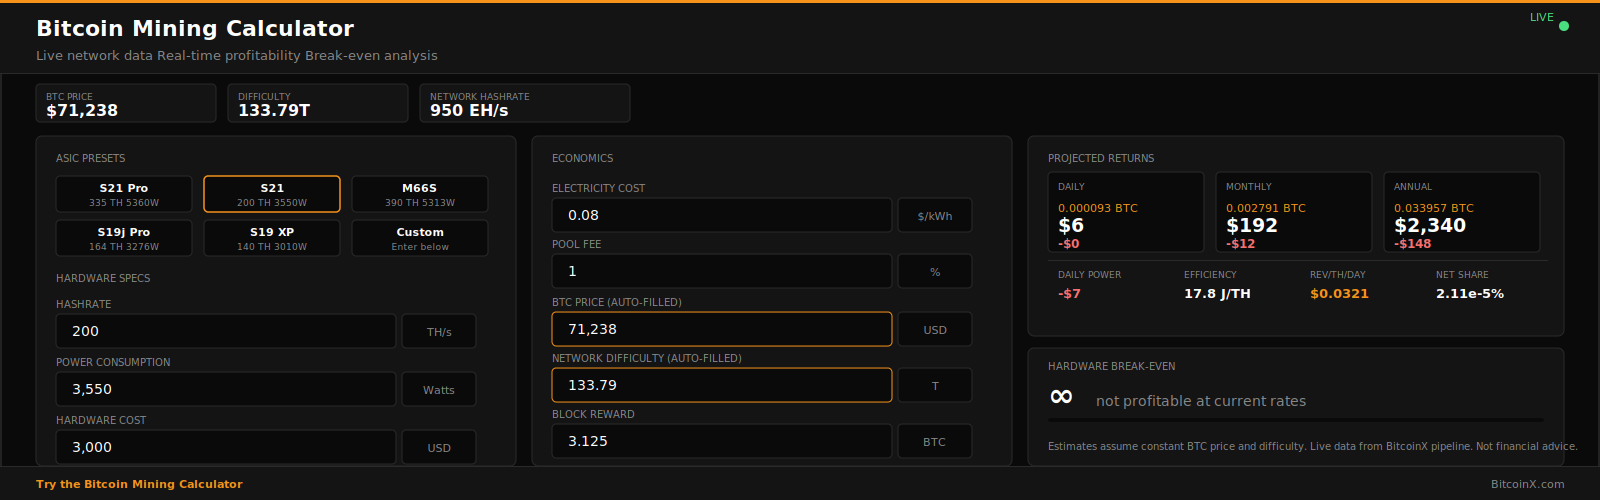
Bitcoin Mining Calculator
Our mining profitability calculator pulls live Bitcoin price, network difficulty, and hashrate directly from our data pipeline — the same data that powers all our dashboards. Enter your ASIC model or custom hashrate, power consumption, and electricity cost to see projected daily, monthly, and annual returns alongside your hardware break-even timeline.
The calculator includes presets for the most popular current-generation mining hardware: the Antminer S21 Pro, S21, Whatsminer M66S, and older generation machines that still operate in areas with very cheap electricity.
Coming Soon: The Bitcoin What If Calculator
What if you had bought Bitcoin instead of IBM stock in 2016? What if your morning coffee budget had gone into Bitcoin since 2015? What if you had bought at the 2022 bottom instead of selling?
We are building a historical return calculator that answers every “what if” — comparing Bitcoin’s actual returns against stocks, real estate, commodities, wages, and everyday purchases across any date range you choose. Powered by our database of 10 years of daily Bitcoin price data alongside stock prices, macro indicators, and cost-of-living data from FRED and other sources.
Bitcoin Data Analytics FAQs
What is the Bitcoin Fear and Greed Index? The Bitcoin Fear and Greed Index is a daily sentiment indicator published by Alternative.me that measures market psychology on a scale from 0 (Extreme Fear) to 100 (Extreme Greed). It draws on volatility, market momentum, social media sentiment, and Google Trends data. Historically, extreme fear readings have preceded significant price recoveries in Bitcoin.
What is the Bitcoin Puell Multiple? The Puell Multiple measures the daily value of newly issued Bitcoin relative to its 365-day moving average. It is a miner stress indicator — when low (below 0.5), miners are earning far less than average, a condition historically associated with Bitcoin price bottoms. When high (above 4.0), miners are thriving and Bitcoin has historically been near a market top.
What is the Bitcoin 200-day moving average? The 200-day moving average (MA200) is the average of Bitcoin’s closing price over the past 200 trading days. It is widely used as an indicator of long-term trend direction. Bitcoin trading above its MA200 is generally considered bullish; trading below is considered bearish. The percentage above or below the MA200 is one of the most-watched metrics by serious Bitcoin investors.
What is a Bitcoin halving? A Bitcoin halving is a scheduled event that occurs approximately every four years — or every 210,000 blocks — in which the reward paid to Bitcoin miners for adding a new block to the blockchain is reduced by 50%. The most recent halving occurred in April 2024, reducing the block reward from 6.25 BTC to 3.125 BTC. Halvings reduce the rate of new Bitcoin supply and have historically preceded significant price appreciation.
How often is this data updated? All Bitcoin price, network, and sentiment data is updated daily. Our data pipeline runs each morning, with BigQuery scheduled queries rebuilding all downstream tables and dashboards by early afternoon UTC. The dashboards reflect data from the previous trading day.
Welcome to one of the web’s first site focused on bitcoin data analytics!