Bitcoin Fear and Greed Index: How to Read It and What It Gets Wrong
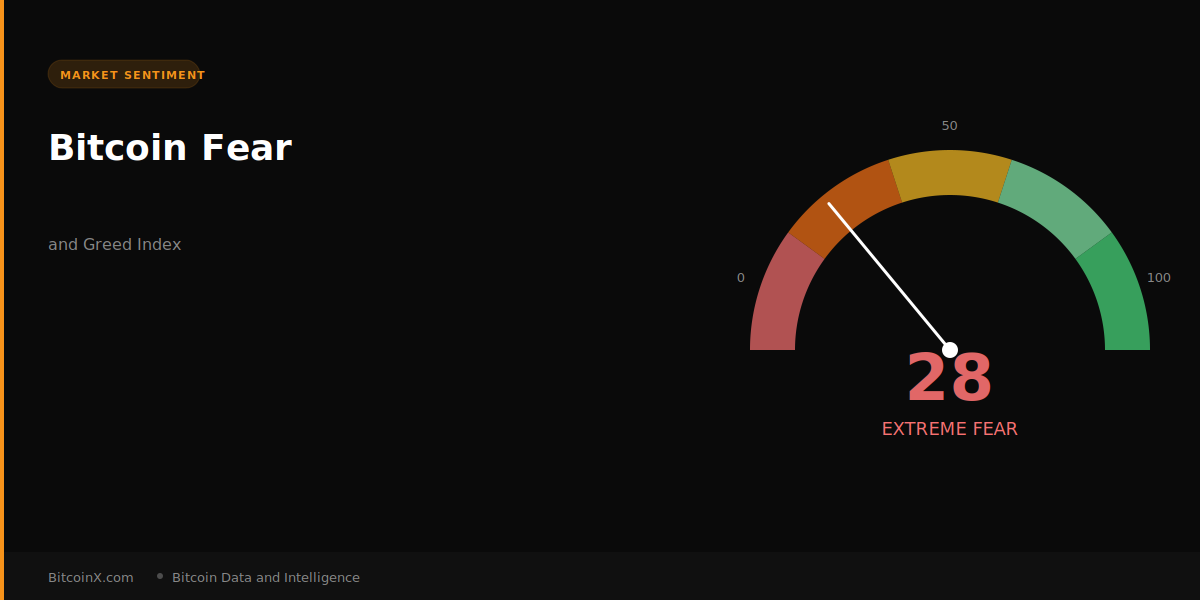
The Bitcoin Fear and Greed Index, published daily by Alternative.me, condenses market sentiment into a single number between 0 and 100. Zero is Extreme Fear — the market is panicking. One hundred is Extreme Greed — the market is euphoric. It sounds simple, and in many ways it is. But using it well requires understanding what it actually measures and where it falls short.
What Goes Into the Index
The Fear and Greed Index is a composite of six data inputs, each weighted differently:
Volatility (25%): Current volatility and maximum drawdowns compared to 30-day and 90-day averages. High volatility = more fear.
Market Momentum and Volume (25%): Current volume and momentum compared to 30-day and 90-day averages. Strong buying volume relative to the average = more greed.
Social Media (15%): Sentiment analysis of Bitcoin-related posts on Twitter and Reddit. High engagement with positive sentiment = more greed.
Surveys (15%): Weekly crypto polls (currently paused but still included in the methodology).
Bitcoin Dominance (10%): A rising Bitcoin dominance suggests investors are moving from altcoins into Bitcoin — often interpreted as risk-off behavior, meaning more fear.
Google Trends (10%): Search volumes for Bitcoin-related queries. Spikes in searches like “Bitcoin manipulation” suggest fear; spikes in “buy Bitcoin” suggest greed.
The Contrarian Use Case
The most commonly cited use of the Fear and Greed Index is as a contrarian indicator: buy when others are fearful, sell when others are greedy. Warren Buffett’s aphorism — “be fearful when others are greedy, and greedy when others are fearful” — applies surprisingly well to Bitcoin historically.
Looking at our 10-year dataset, extreme fear readings (below 25) have tended to cluster around Bitcoin’s major market bottoms. The COVID crash of March 2020, the post-FTX collapse of November 2022, and the 2018-2019 bear market bottom all registered extreme fear for extended periods. Investors who bought during these periods and held for 12–18 months were generally rewarded.
Conversely, extreme greed readings (above 75) have clustered around major market tops. The November 2021 all-time high, the April 2021 local top, and the late 2017 parabola all registered extreme greed before sharp reversals.
What the Index Gets Wrong
Despite its usefulness as a general sentiment gauge, the Fear and Greed Index has meaningful limitations.
It lags the market. Sentiment is a reflection of price, not a predictor of it. When price is falling, sentiment turns fearful — but this happens after the decline, not before it. The index will not warn you that a crash is coming; it will confirm that a crash has already happened.
Extreme readings can persist. During the 2022 bear market, the index registered extreme fear for months. Being a pure contrarian and buying at the first extreme fear reading would have meant buying well before the final bottom.
It does not distinguish between types of fear. Fear driven by temporary negative news is very different from fear driven by fundamental structural problems in the market. The index treats both the same way.
The social media component is noisy. Crypto Twitter is not a representative sample of Bitcoin investors, and sentiment there can diverge significantly from actual market behavior.
Our Data
We track the Fear and Greed Index daily going back to 2018. Over that period, Bitcoin has spent more time in fear than greed — roughly 57% of days have registered readings below 50. The distribution is not symmetric: extreme fear is more common than extreme greed, which may reflect Bitcoin’s historical pattern of long bear markets punctuated by sharp bull runs.
As of today, the index reads 28 — Extreme Fear. Whether that represents an opportunity or a warning sign depends on the broader context, which is why we track it alongside price, moving averages, and miner data rather than in isolation.