Bitcoin Death Cross vs. Golden Cross: What the Data Actually Shows
Few technical analysis concepts generate more attention — and more misunderstanding — than the death cross and the golden cross. When Bitcoin’s 50-day moving average crosses below its 200-day moving average, it is called a death cross. When the 50-day crosses above the 200-day, it is called a golden cross. These events are covered breathlessly by financial media every time they occur. But do they actually predict future price movement?
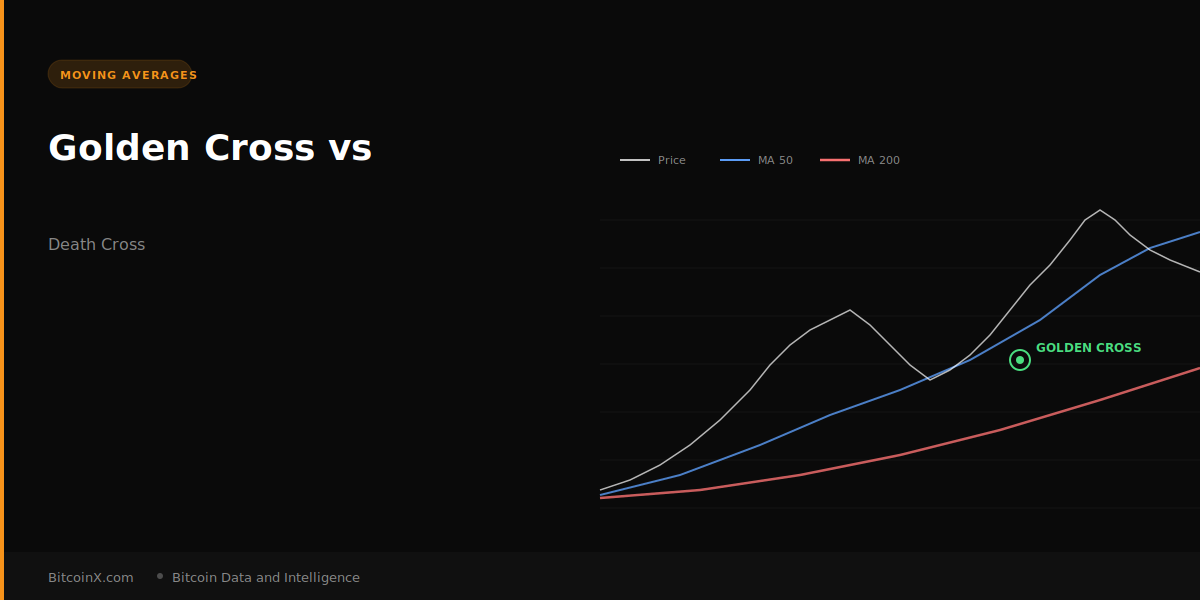
What a Moving Average Cross Represents
Moving averages smooth out daily price noise to show underlying trends. The 50-day MA reflects medium-term momentum — where Bitcoin has been trading over the past two months. The 200-day MA reflects long-term trend — where Bitcoin has been trading over roughly the past year.
When the 50-day crosses below the 200-day (death cross), it means the medium-term trend has turned negative relative to the long-term trend. It signals that recent performance has been weaker than the broader historical average. When the 50-day crosses above the 200-day (golden cross), the opposite is true — recent performance has strengthened relative to the long-term baseline.
Historical Death Crosses and What Followed
Looking at our dataset from 2016 to present, Bitcoin has experienced multiple confirmed death cross events. The one that gets the most attention occurred in early 2022 — Bitcoin crossed below its 200-day MA in January 2022 and did not reclaim it until early 2023. The price decline over that period exceeded 70%.
However, the death cross itself did not cause the decline — it confirmed it. The death cross is a lagging indicator, meaning by the time it triggers, a significant portion of the downside has often already occurred.
The 2019 death cross is a useful case study. Bitcoin’s 50-day crossed below its 200-day in April 2019, after a rally from the 2018 lows. Many traders took this as a bearish signal. Bitcoin then rallied to over $13,000 within months before declining again. Traders who sold at the death cross and missed that move learned an expensive lesson about lagging indicators.
Historical Golden Crosses and What Followed
The golden cross has a more consistent historical track record as a positive signal — but it is still not a reliable short-term timing tool.
The golden cross of May 2020 preceded one of Bitcoin’s greatest bull runs, with price moving from roughly $8,500 to $69,000 over the following 18 months. The golden cross of February 2019 preceded a significant rally. The golden cross of August 2015 came near the beginning of the 2016-2017 bull market.
But not all golden crosses lead to sustained bull markets. Some are followed by choppy, sideways price action. The key factor is broader market context — a golden cross in a fundamentally positive environment carries more weight than one in a period of macro uncertainty.
Current Signal
As of our most recent data, the MA 50 for Bitcoin sits at approximately $116,666 while the MA 200 sits at $110,483. Technically, the 50-day remains above the 200-day — meaning the signal is currently a golden cross despite recent price weakness. Bitcoin’s price at approximately $71,000 is trading well below both moving averages, which is a bearish configuration even within a nominal golden cross reading.
This is precisely why watching the price relative to moving averages matters as much as watching the cross itself. A golden cross with price below both MAs tells a very different story than a golden cross with price above both.
We track the MA signal in real time on our MA Cross Signals dashboard, alongside the percentage above or below the 200-day MA.