
Bitcoin vs US National Debt
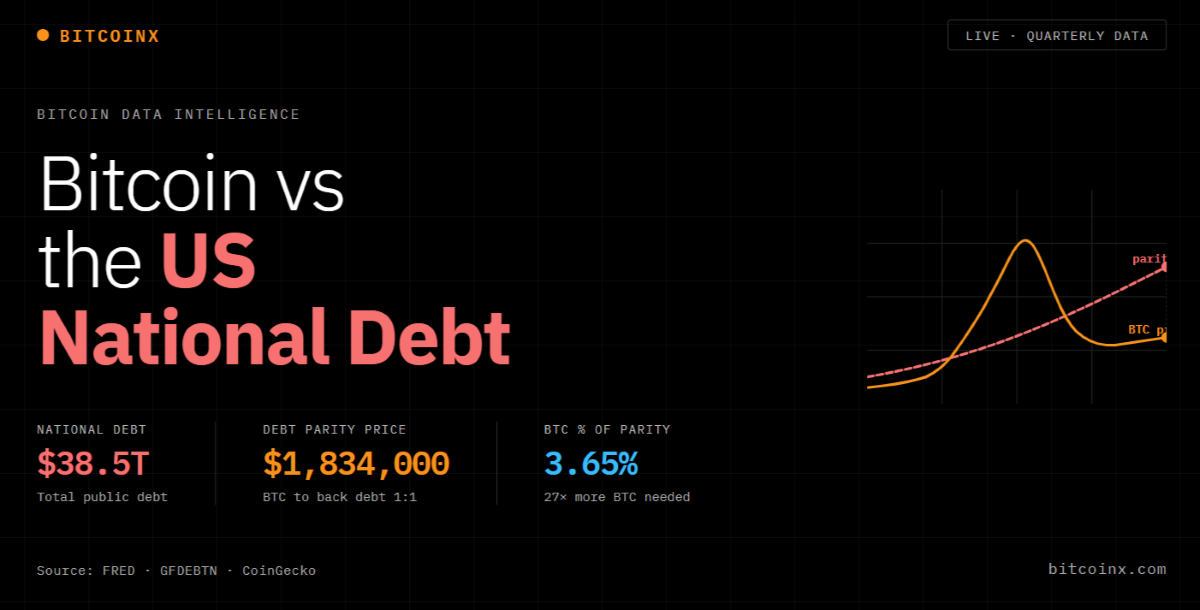
The US national debt now exceeds $38.5 trillion — and only 21 million Bitcoin will ever exist. This tool tracks the debt parity price: what Bitcoin would need to be worth for the entire supply to cover the national debt 1:1. At current prices, BTC sits at just 3.65% of that number, meaning the debt is growing faster than Bitcoin appreciates. Debt data from FRED · GFDEBTN, updated quarterly. Watch what happens with Bitcoin vs US national debt on Bitcoinx.com
The debt parity price tells a macro story that no nominal chart captures — the dollar is being debased faster than Bitcoin appreciates. Pair it with the Bitcoin Inflation Adjusted Price to see purchasing power erosion in real terms, or check the Bitcoin Halving Tracker to understand how supply cycles interact with this long-term debt trajectory.
What Is the Bitcoin Debt Parity Price?
The debt parity price is a simple but striking calculation: divide the total US national debt by Bitcoin’s fixed maximum supply of 21 million coins. The result is the price BTC would need to reach for the entire Bitcoin supply to equal the national debt in dollar terms. It is not a price target — it is a ratio that reveals how aggressively the US is borrowing relative to Bitcoin’s strictly fixed monetary base.
Why the Gap Keeps Growing
The staircase pattern on the debt parity line reflects quarterly debt issuance — the US borrows in large, regular increments regardless of market conditions. Bitcoin’s price moves with demand and halving cycles. The result is a persistent and widening gap. Since 2016, the national debt has grown from roughly $19 trillion to over $38 trillion while Bitcoin has gone from under $500 to over $65,000 — yet BTC still covers less than 4% of parity. For context on how Bitcoin’s supply schedule interacts with this dynamic, see the Bitcoin Halving Tracker.
What This Chart Actually Tells You
This is not a chart about whether Bitcoin will reach a specific price. It is a chart about the math of fiat monetary policy. Every time Congress raises the debt ceiling, the parity price rises. Every time Bitcoin appreciates, the gap narrows slightly. The ratio captures the tension between an infinitely expandable fiat system and a strictly capped digital asset. To see the purchasing power dimension of the same story, visit the Bitcoin Inflation Adjusted Price tool.
Bitcoivn vs US National Debt FAQs
Could Bitcoin ever actually reach the debt parity price? At the current debt parity price of $1.83 million per BTC, that would require a roughly 27x increase from today’s price. It is mathematically possible — Bitcoin has delivered larger moves from lower prices — but the debt is also growing continuously, so the target moves. The more useful framing is directional: is the gap narrowing or widening over time?
Why use 21 million as the divisor and not circulating supply? Using the fixed maximum supply makes the calculation stable and honest. Circulating supply grows as miners issue new coins and shrinks as coins are lost — it is a moving target that would make historical comparisons inconsistent. The 21 million cap is one of Bitcoin’s few truly fixed parameters and the most meaningful one for this analysis.
How does this compare to Bitcoin’s market cap vs the national debt? The debt parity price answers a different question than market cap. Market cap — current price times circulating supply — fluctuates with both price and supply. The parity price uses the fixed maximum supply and asks what price would be required, not what the market currently values the network at. It is a forward-looking stress test, not a current valuation.
How often does the debt data update? The US Treasury reports total public debt daily, but the FRED GFDEBTN series aggregates this to quarterly data. This chart updates the debt figure each quarter when FRED publishes the new reading. Bitcoin price data updates daily. Track real-time sentiment alongside this long-term macro view with the Fear and Greed Index.
Link: “Fear and Greed Index” → bitcoinx.com/bitcoin-fear-and-greed-index/
Is this analysis bullish or bearish on Bitcoin? Neither — it is purely mathematical. The chart shows the relationship between two numbers: the US debt and Bitcoin’s maximum supply. Whether you interpret the widening gap as an argument for Bitcoin’s upside potential or simply as a measure of the debt problem is a matter of perspective. The data does not editorialize.